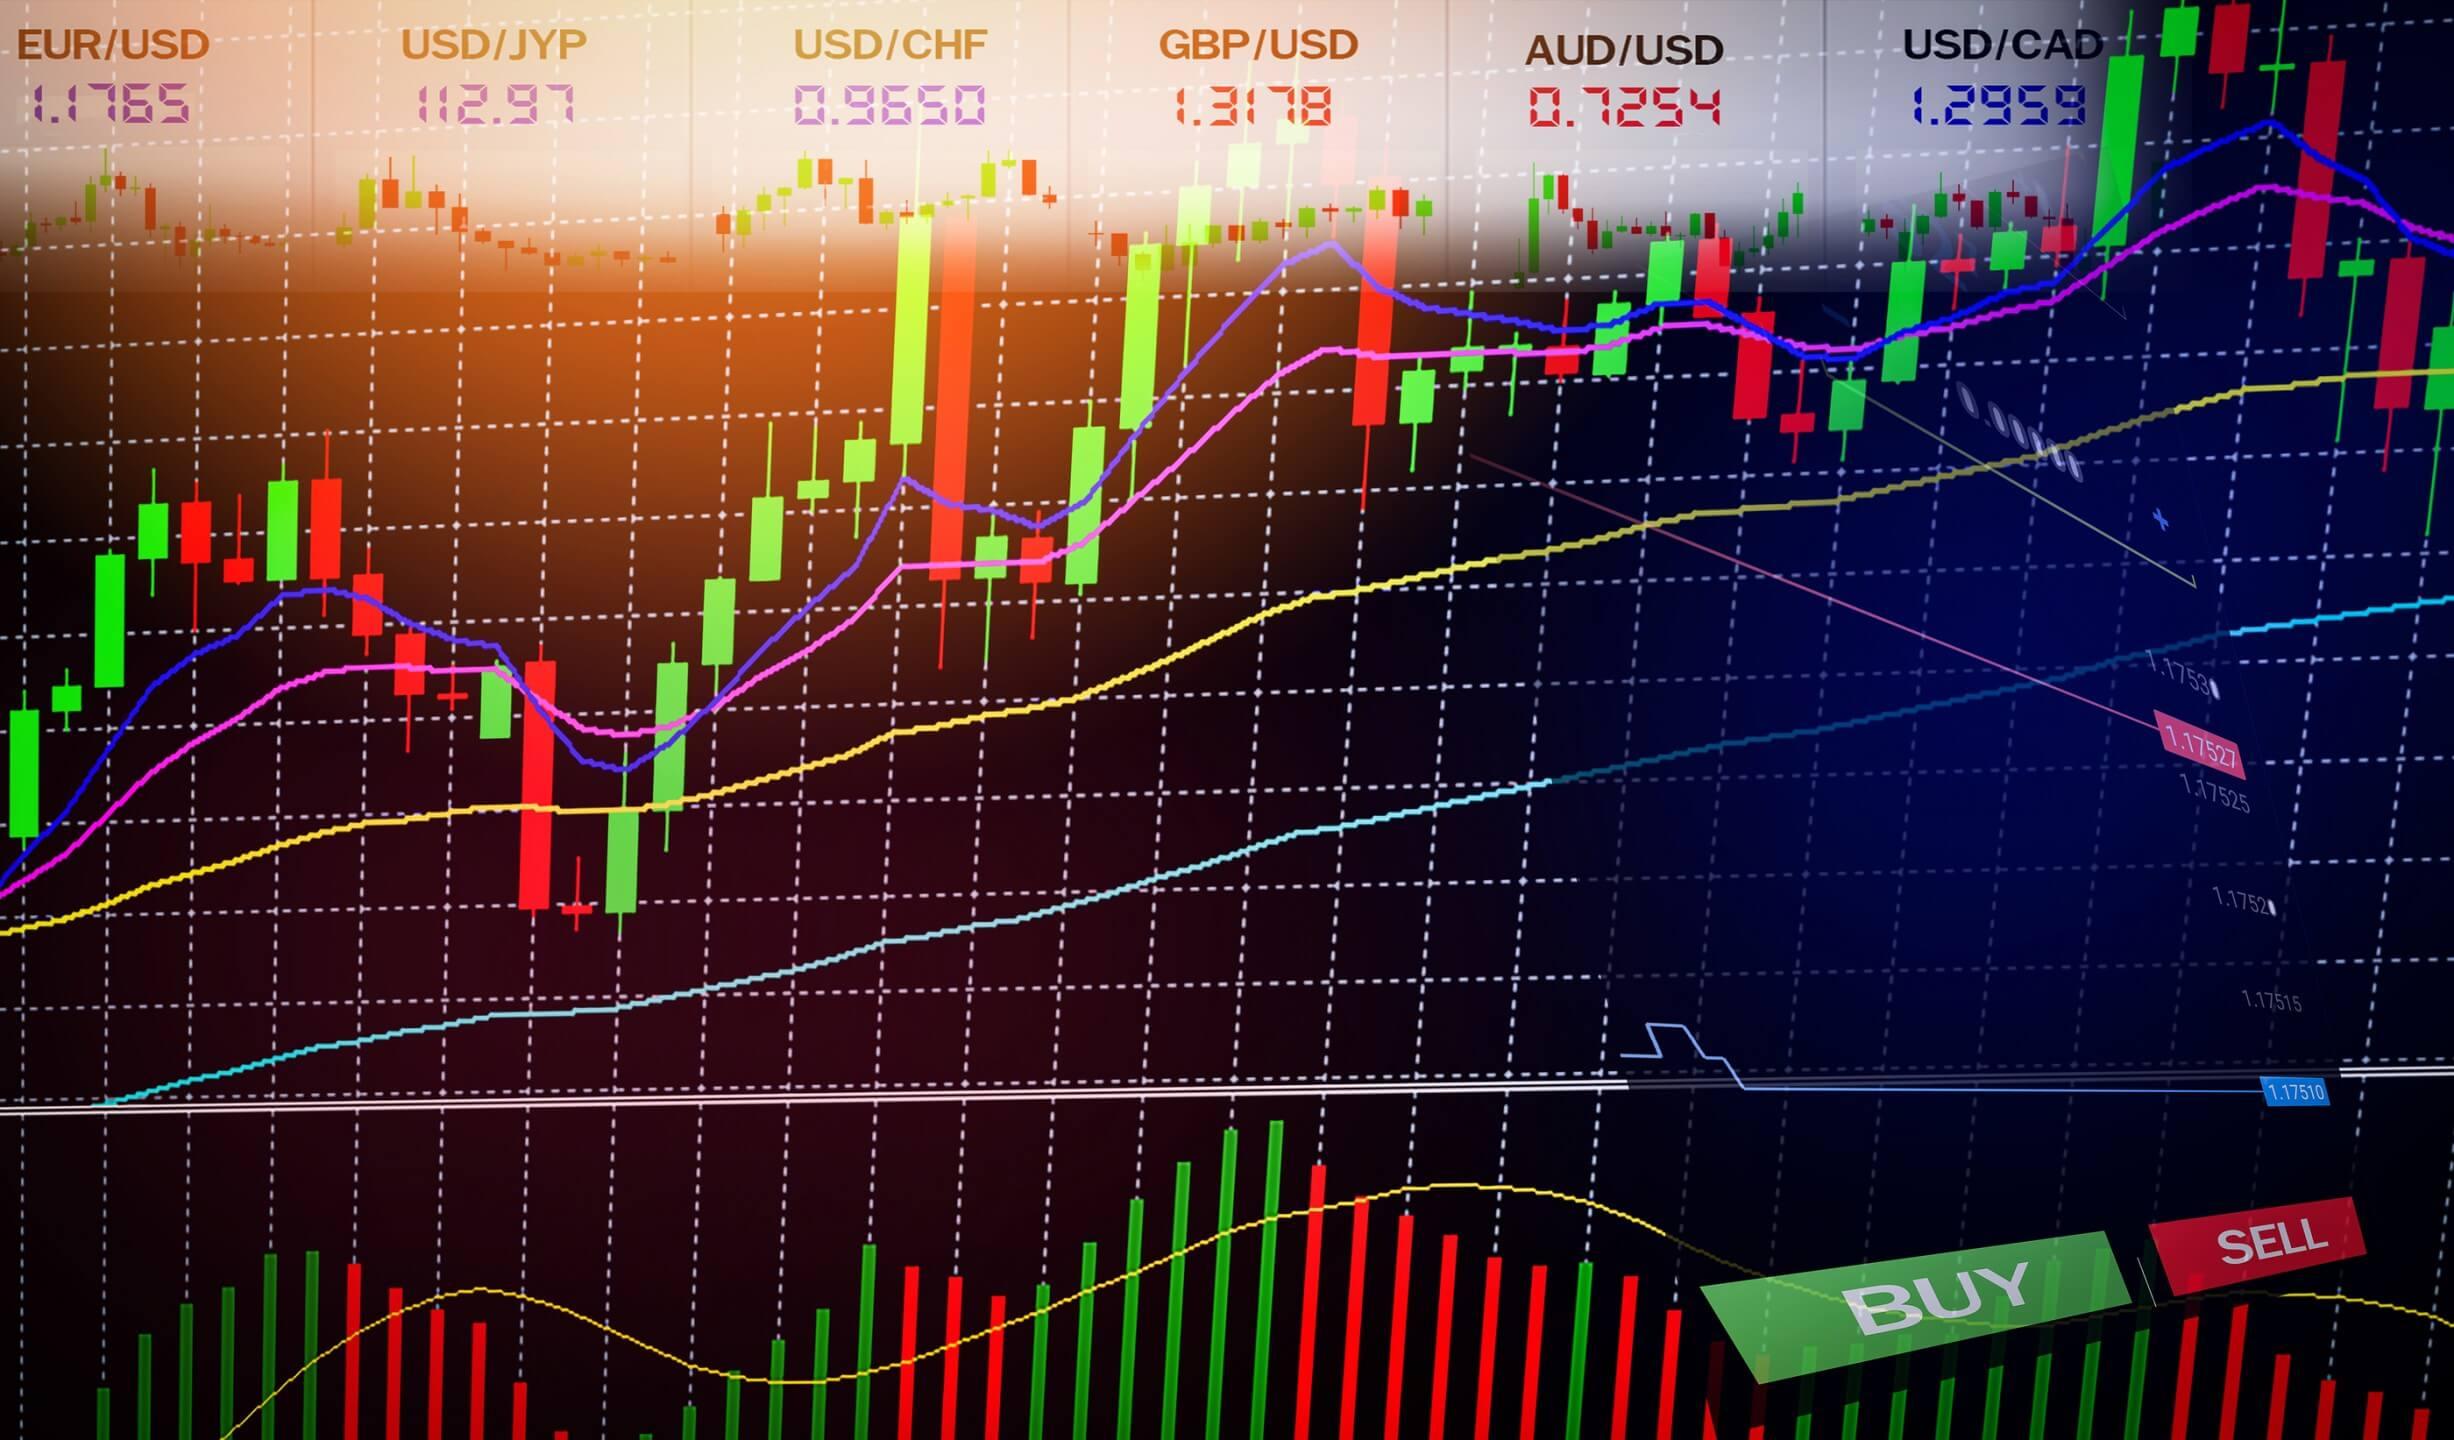
Forex trading is a dynamic and intricate financial market where traders navigate the complexities of global currency movements. To make informed decisions in this fast-paced environment, traders rely on a variety of tools, and one of the most crucial among them is the use of forex trading indicators. These indicators are powerful instruments that assist traders in analyzing market trends, identifying potential entry and exit points, and ultimately making more accurate predictions about price movements.
What are Forex Trading Indicators?
Forex trading indicators are mathematical calculations based on historical and real-time price data, volume, or open interest. These indicators provide traders with visual representations of market trends and patterns, helping them make sense of the vast amount of information available. Traders use indicators to gain insights into potential market reversals, trend strengths, and potential entry or exit points for their trades.
Types of Forex Trading Indicators:
Trend Indicators:
Moving Averages: Simple Moving Averages (SMA) and Exponential Moving Averages (EMA) are popular indicators that smooth out price data over a specific period, revealing the direction of the prevailing trend.
Momentum Indicators:
Relative Strength Index (RSI): RSI measures the speed and change of price movements. It is a momentum oscillator that helps identify overbought or oversold conditions in the market click .
Volatility Indicators:
Bollinger Bands: These indicators consist of a middle band being an N-period simple moving average, an upper band at K times an N-period standard deviation above the middle band, and a lower band at K times an N-period standard deviation below the middle band. Bollinger Bands help traders identify volatility and potential price reversal points.
Volume Indicators:
On-Balance Volume (OBV): OBV tracks cumulative buying and selling pressure, indicating the strength of a trend based on volume changes. It is particularly useful for confirming price trends.
Oscillators:
Moving Average Convergence Divergence (MACD): MACD is a trend-following momentum indicator that shows the relationship between two moving averages of a security’s price. Traders use MACD to identify potential buy and sell signals.
How to Use Forex Trading Indicators:
Confirmation of Trends:
Traders use indicators to confirm the direction of trends identified through other analysis methods. For example, a moving average crossover can validate the beginning of a new trend.
Identifying Overbought or Oversold Conditions:
Oscillators like RSI can help traders identify when a currency pair is overbought (potential sell signal) or oversold (potential buy signal), indicating a possible trend reversal.
Entry and Exit Points:
Indicators can provide precise entry and exit points for trades. For instance, Bollinger Bands can signal potential reversal points when the price hits the upper or lower band.
Divergence Analysis:
Traders use divergence between price and an indicator to spot potential trend reversals. For example, if prices are making new highs, but the RSI is not, it may indicate weakening momentum.
Risk Management:
Indicators can be used to set stop-loss and take-profit levels based on historical price movements and volatility.
Conclusion:
Forex trading indicators are invaluable tools for traders seeking to navigate the complexities of the currency markets. While they don't guarantee success, when used in conjunction with other forms of analysis, indicators can significantly enhance a trader's ability to make informed decisions. Traders should understand the strengths and limitations of each indicator, and how to effectively integrate them into their trading strategies. Ultimately, a well-rounded approach, combining technical and fundamental analysis, along with a solid understanding of market psychology, is key to success in the world of forex trading.
Sponsored
Understanding Forex Trading Indicators: A Comprehensive Guide to Market Analysis
Posted 2024-01-30 06:03:59
0
57

Search
Sponsored
Categories
- Art
- Causes
- Crafts
- Dance
- Drinks
- Film
- Fitness
- Food
- Games
- Gardening
- Health
- Home
- Literature
- Music
- Networking
- Other
- Party
- Religion
- Shopping
- Sports
- Theater
- Wellness
Read More
Specialty Surfactant Market Major Services, Growth, Regions, Trends And Opportunity Insights Till 2030
The specialty surfactant market has witnessed significant growth in recent years, driven by the...
Print Label Market is Estimated to Witness High Growth Owing to Increase in E-Commerce Sales
Print labels are used to provide information about products and for product identification. They...
Gas Separation Membranes Market Size, Growth, Report 2023-2028
The new report by Expert Market Research titled, ‘Global Gas Separation Membranes...
LipoSlend Reviews Price & Official Reviews (2024)
LipoSlend Reviews is an extraordinary, advancement weight reduction supplement that upholds the...
Computer System Validation Market Is Estimated To Witness High Growth Owing To Increasing Focus On Data Protection And Compliance
Computer system validation plays a crucial role in regulated industries such as life sciences,...
Sponsored